
Vitals Detection Using Computer Vision
Published:
A brief presentation summarising the project and results can be found here. The detailed report of training can be found here.
This project was developed as part of the 3 month long “Computer Vision and Signal Processing Internship” with MetFlux Research, a privately held, healthcare oriented startup at IIT Bombay. MATLAB, Python, and SOTA computer vision algorithms were used to create light-weight frameworks for realtime determination of Heart Rate, SpO2, Blood Pressure.
One of the main goals of the project was to come up with techniques that could be used by everyday laymens to feed into the system their vital parameters. The company simply couldn’t use complicated methods for parameter detection. Nor could they possibly ask the user to feed in these values on their own. This is because such approaches would take away the ease of use of the application they had already launched. The company has an application called “ MyFitPrint” which is a mobile app that helps one track their health and take care of their nutritional intakes and such. They wanted to develop an easy integration into their already existing framework that did the job. In such a case, the technique of photoplethysmography became the answer.
Photoplethysmography is a relatively recent technique derived from plethysmography. Plethysmography is used to measure changes in volume in different parts of the body. The test may be done to check for blood clots in the arms and legs. It is also done to measure how much air you can hold in your lungs. Most commonly, this test is performed to check blood flow in the arteries of the legs. This is done in people with conditions like hardening of the arteries (atherosclerosis). Atherosclerosis causes pain during exercise or poor healing of leg wounds. The technique is performed using a plethysmograph.
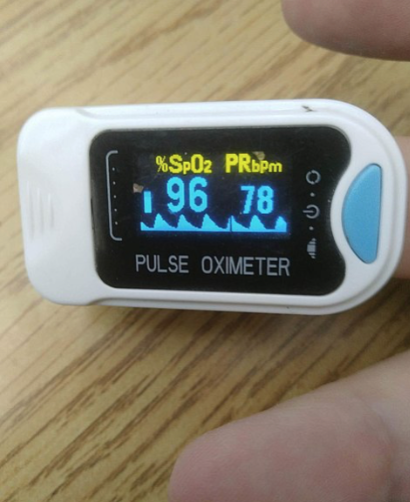
A plethysmograph is an instrument for measuring changes in volume within an organ or whole body (usually resulting from fluctuations in the amount of blood or air it contains). The word is derived from the Greek “plethysmos” (increasing, enlarging, becoming full), and “graphein” (to write). A photoplethysmogram (PPG) is an optically obtained plethysmogram that can be used to detect blood volume changes in the microvascular bed of tissue. A PPG is often obtained by using a pulse oximeter which illuminates the skin and measures changes in light absorption. A conventional pulse oximeter monitors the perfusion of blood to the dermis and subcutaneous tissue of the skin.
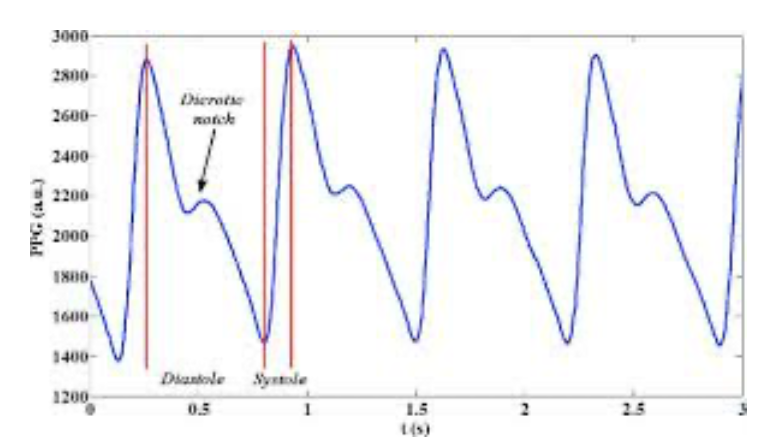
With each cardiac cycle the heart pumps blood to the periphery. Even though this pressure pulse is somewhat damped by the time it reaches the skin, it is enough to distend the arteries and arterioles in the subcutaneous tissue. If the pulse oximeter is attached without compressing the skin, a pressure pulse can also be seen from the venous plexus, as a small secondary peak.
The change in volume caused by the pressure pulse is detected by illuminating the skin with the light from a light-emitting diode (LED) and then measuring the amount of light either transmitted or reflected to a photodiode. Each cardiac cycle appears as a peak, as seen in the figure. Because blood flow to the skin can be modulated by multiple other physiological systems, the PPG can also be used to monitor breathing, hypovolemia, and other circulatory conditions. Additionally, the shape of the PPG waveform differs from subject to subject, and varies with the location and manner in which the pulse oximeter is attached.
While photoplethysmography commonly requires some form of contact with the human skin (e.g., ear, finger), remote photoplethysmography allows to determine physiological processes such as blood flow without skin contact. This is achieved by using face video to analyze subtle momentary changes in the subject’s skin color which are not detectable to the human eye. Such camera-based measurement of blood oxygen levels provides a contactless alternative to conventional photoplethysmography. For instance, it can be used to monitor the heart rate of newborn babies, or analyzed with deep neural networks to quantify stress levels. In the current project, both contact and non-contact photoplethysmography were used in order to obtain the required parameters.
In the first week of the training, the goals were clearly specified. In a team of three interns, each individual was charged with the responsibility of finalising models for three parameters. The parameters assigned for the current project were thus, the heart rate, the blood pressure, and the SpO2 levels. During the course of project development, multiple research models proposed for detection of these parameters were programmed and then evaluated. At the end, about four final models were finalised and these produced less than 5% overall error margin in the penultimate trials.